Debugging
Debugging is an essential part of locating and fixing issues during development. Qingkuai component files are compiled into standard JavaScript modules, so you can use browser DevTools, the VS Code debugger, and tools like Vite to inspect component logic, reactive state, and rendering behavior. This article covers common debugging techniques for Qingkuai projects.
Source Maps
In development mode, the compiler generates source maps for component files by default, mapping compiled output back to the original component file across two dimensions:
Script mapping: Maps compiled JavaScript code back to the script block or template interpolation in the component file, so you can inspect variables and set breakpoints in the original source.
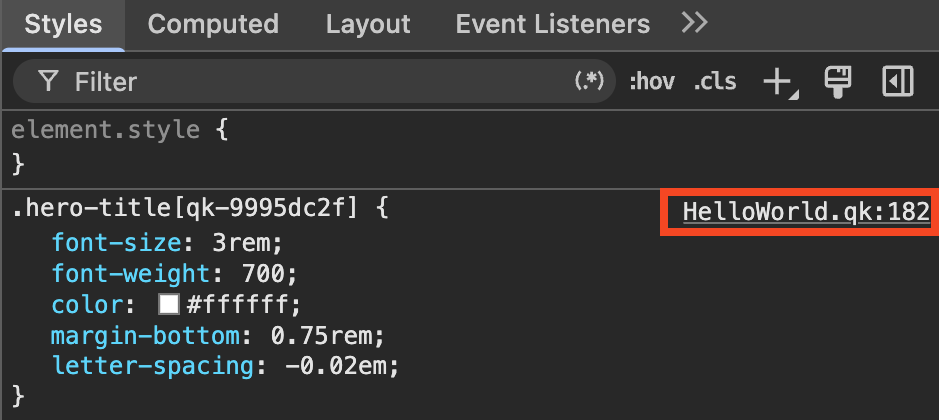
Style mapping: Maps compiled CSS back to the style block in the component file, so the browser's Styles panel shows the original rules instead of the compiled stylesheet.
Prerequisites
Make sure
JavaScript source mapsandCSS source mapsare enabled in your browser's DevTools settings.If you use vite-plugin-qingkuai, source maps are enabled by default in development mode. For other build tools, refer to their documentation for configuration.
Script Debugging
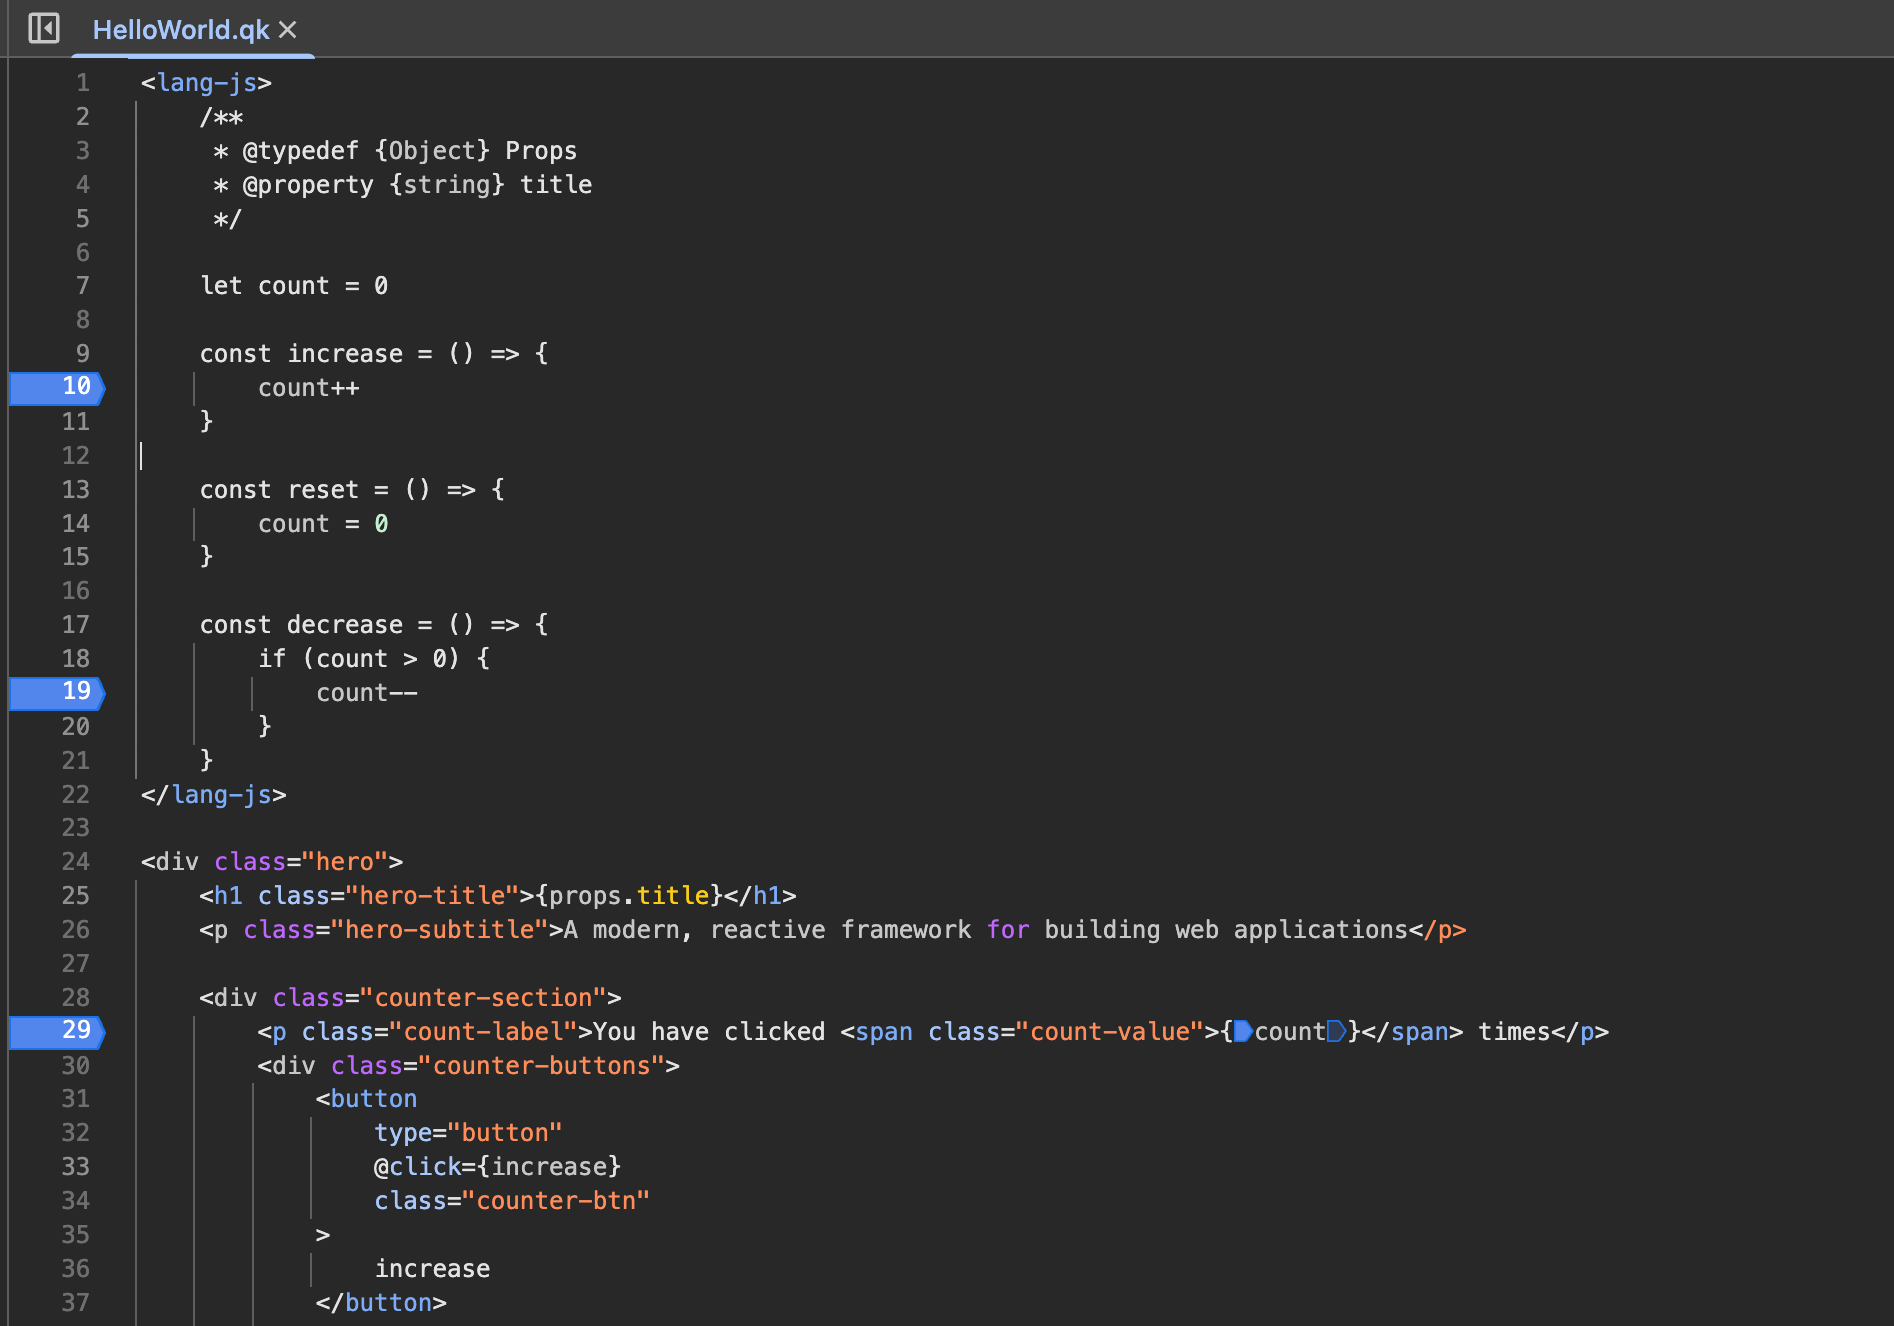
For code inside embedded script blocks and template interpolations, you can open the corresponding component file in the browser DevTools Sources panel and set breakpoints there:
Reactive Values
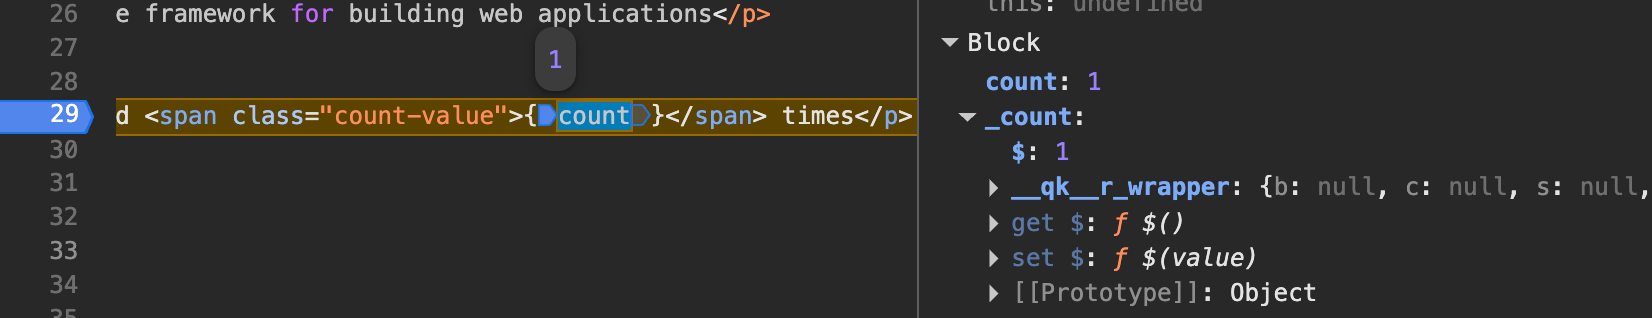
In development mode, the compiler preserves the original identifiers of reactive values. In the DevTools Scope panel, you will notice that each reactive identifier has a corresponding wrapper value (usually prefixed with _), which is the actual reactive value used by the compiler internally. You can ignore it during debugging — the compiler-generated debug code automatically syncs the original identifier whenever the reactive value changes, so you can always focus solely on the original identifier:
Directive Context
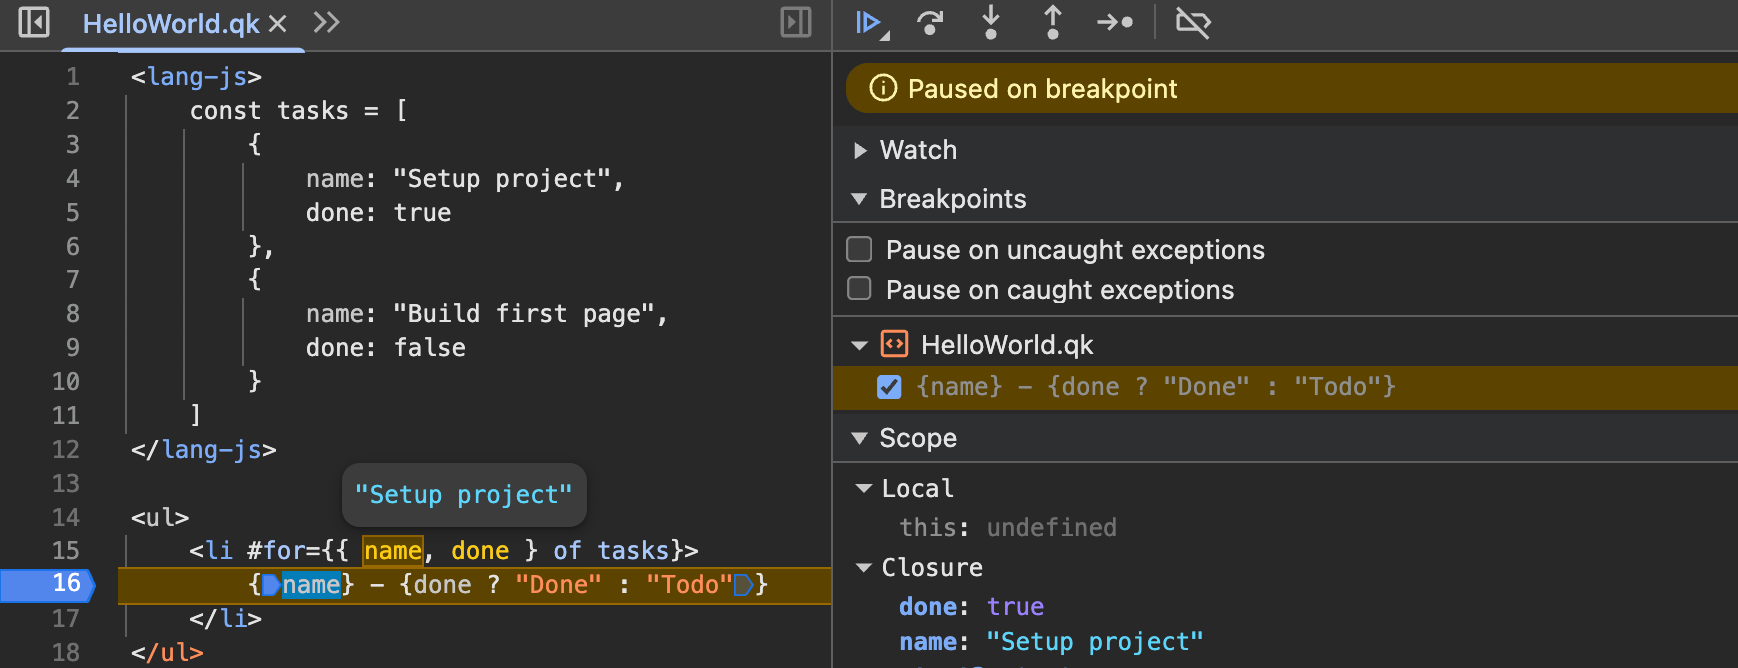
In development mode, the compiler attaches debug information to context identifiers created by directives, giving you a clearer picture of the directive's execution context:
Interpolation Block Updates
As you may have noticed from the screenshots above, the compiler creates mapping points at the start and end of each interpolation block. This allows you to clearly see the state of the DOM before and after an update, helping you better understand the component's update process.
Style Debugging
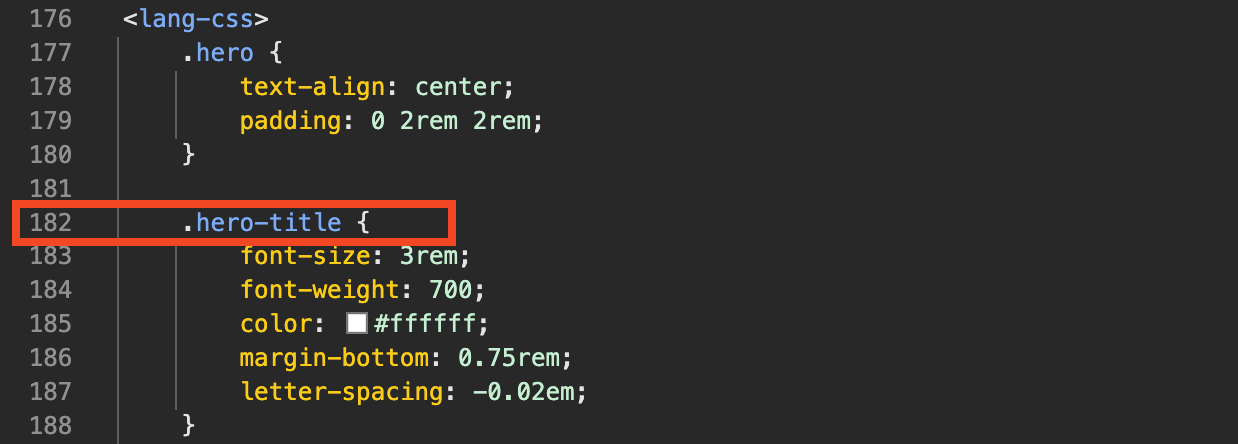
For style blocks in component files, you can inspect element styles in the browser DevTools Elements panel. Click the file path next to a rule to navigate to the original style in the component file:
This will jump to the Sources panel and highlight the corresponding rule in the style block: